Pro Runtime Debugger
Pro Feature
The runtime debugger is only available in UIFlow Pro.
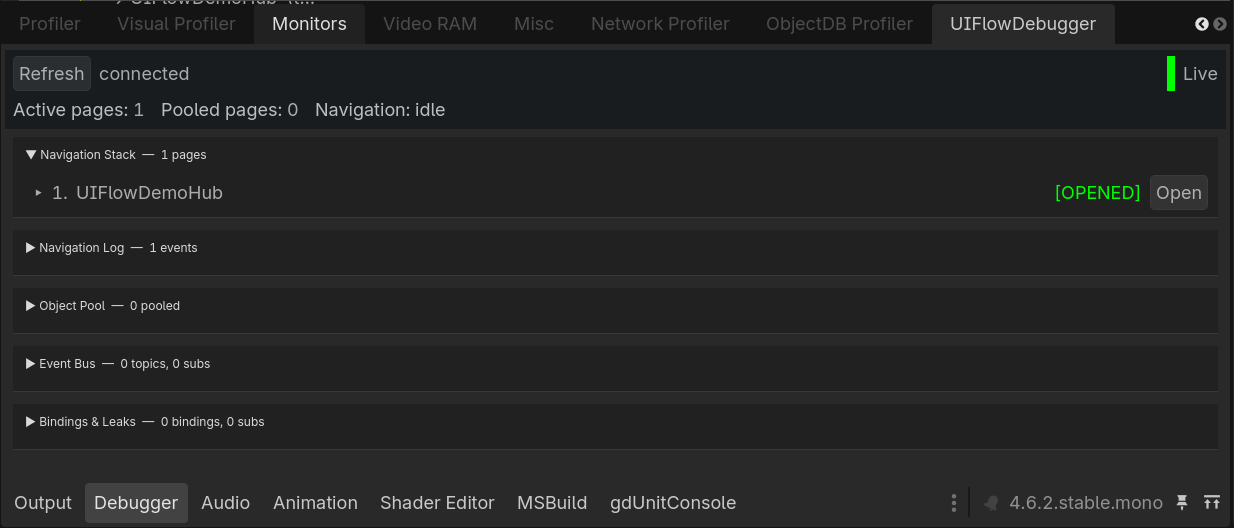
UIFlow Pro ships with a runtime debugger panel that attaches to the running game and streams UI state to the Godot editor.
Captured Data
The debugger captures the following channels:
| Channel | What you see |
|---|---|
stack |
Current navigation stack, page states, and modal flags. |
pool |
Object pool contents, acquire/release counts, and pool size. |
event_bus |
Active subscriptions, sticky values, and recent emits. |
memory |
Estimated UI node counts and memory pressure. |
bindings |
Active property/signal/list bindings per page. |
log_snapshot |
Recent UIFlow log entries. |
How to Use
- Enable the UIFlow Pro plugin.
- Run your scene from the editor.
- Open the UIFlow Debugger dock.
- Select a channel to inspect live data.
The debugger uses a custom debug bridge (UIFlowProDebugBridge) autoload. It only runs inside the editor and is automatically removed from release builds.
Use Cases
- A page is not opening: check the
stackchannel for blocked navigation or guard rejections. - Memory is climbing: inspect
poolandmemoryfor leaked page instances. - A binding is not updating: verify it exists in the
bindingschannel. - An event is not firing: confirm subscriptions in the
event_buschannel.
Security Note
The debug bridge is editor-only and does not expose data in exported projects. Do not manually reference it from game code.